The short answer: Critical incident mapping vs 2D floor plan compares static architectural drawings to geospatially aware, asset-rich digital models built for emergency response. The critical incident mapping vs 2D floor plan decision turns on response-time impact, lifecycle accuracy, and interoperability with public safety systems. Three variables move the needle: spatial precision, real-time asset visibility, and responder access. For multi-floor incidents, indoor-map routing cut travel distance an average 28.4 percent; reaching a third-floor lab dropped from 215 seconds to 154 seconds (IJSRA, 2025).
When first responders arrive at a school, hospital, or corporate campus during an active threat, the difference between a paper floor plan and a living digital twin can measure in lives. Traditional 2D floor plans freeze a building at the moment the architect drew them. They show walls and doors, but not the locked stairwell that was added last year or the AED moved to the second-floor break room three months ago.
Critical incident mapping vs 2D floor plan isn't just a format upgrade. It's the difference between a static artifact and a geospatially aware, lifecycle-current model that integrates with dispatch systems, mobile apps, and on-site security platforms. As state legislatures mandate digital mapping for schools and public venues, the question's no longer whether to digitize but which approach delivers the situational awareness responders need under pressure.
What Makes a 2D Floor Plan Different from Critical Incident Mapping?
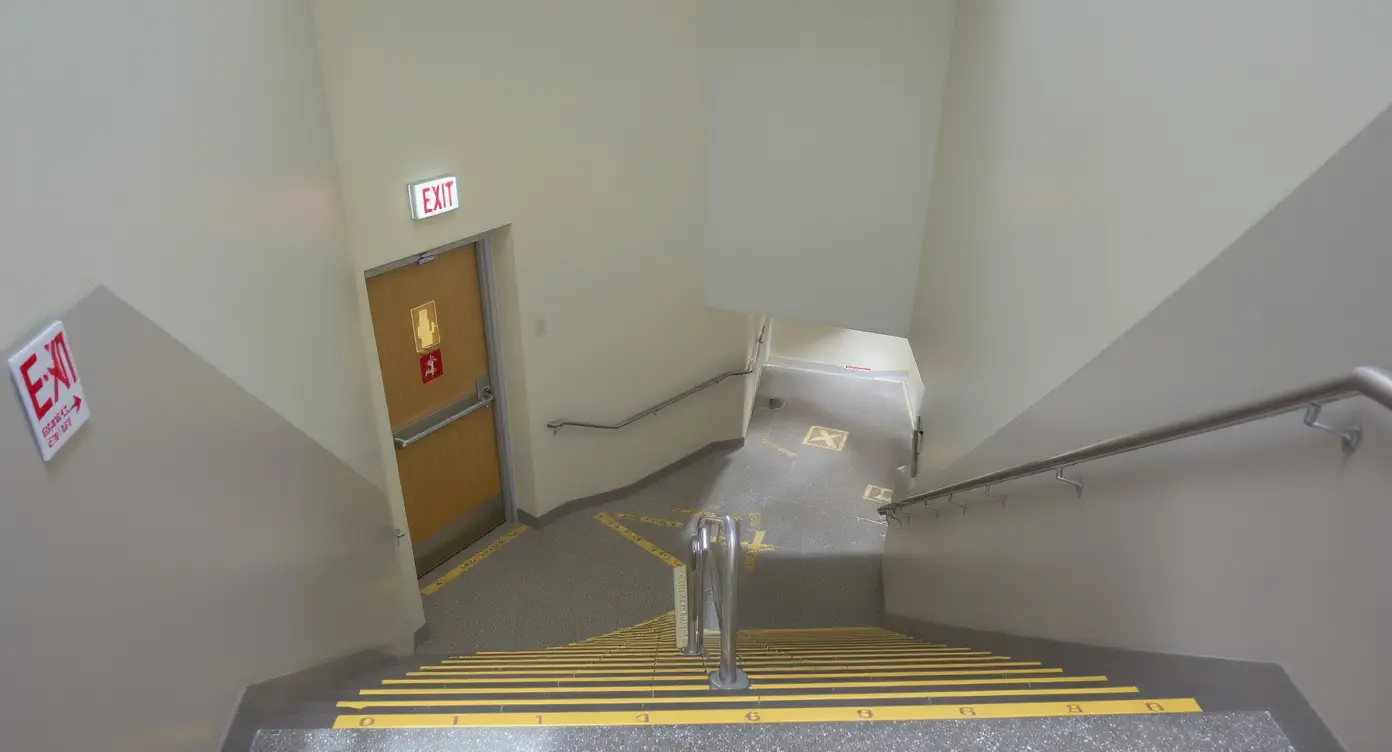
A 2D floor plan is an architectural drawing. It shows room outlines, walls, doors, and basic dimensions. Most were created for construction or renovation, not emergency response. They live as PDFs in a facilities folder or as paper copies in a binder at the front desk.
Critical incident mapping vs 2D floor plan starts with that floor plan but adds layers of operational intelligence. A critical incident map overlays the building footprint onto satellite imagery, aligns it to true north, and adds an alphanumeric grid so dispatchers and responders can reference precise locations. It includes asset markers for exits, fire extinguishers, AEDs, camera locations, utility shutoffs, and hazardous material storage.
The map is designed to integrate with Computer-Aided Dispatch systems, allowing dispatchers to share location data with responding units. It's designed to be viewed on mobile devices in the field, not just printed and posted on a wall.
The Structural Limits of a Traditional Floor Plan
A 2D floor plan captures a building at a single point in time. When the school adds a portable classroom, renovates a wing, or changes a door from inward-swing to outward-swing for code compliance, the floor plan doesn't update itself. Facilities teams rarely have the budget or workflow to commission a new drawing every time the building changes.
Floor plans also lack geospatial context. They don't show the building's orientation relative to surrounding streets, parking lots, or neighboring structures. A responder arriving from the north side of campus can't easily translate a floor plan into a navigation decision. There's no coordinate system, no grid overlay, and no way to communicate a precise location over the radio beyond "second floor, east wing, near the gym."
How Critical Incident Maps Add Operational Layers
Critical incident mapping vs 2D floor plan introduces three operational layers. First, geospatial alignment places the building in real-world coordinates. The map shows true north, surrounding terrain, and access routes. Responders can see which entrance is closest to the reported incident and which roads provide the fastest approach.
Second, asset tagging identifies resources and hazards. Icons mark fire alarm pull stations, sprinkler risers, natural gas shutoffs, and emergency lighting panels. In a school, the map shows which classrooms have interior locks, which stairwells are wheelchair-accessible, and where the nearest trauma kit is stored.
Third, interoperability connects the map to other systems. Some platforms are designed to push map data to dispatch consoles, mobile apps, and in-vehicle computers. When a 911 call comes in, the dispatcher can see the caller's location on the map and share that view with responding units in real time.
Why Do Response Times Improve with Spatial Precision?
Response time is the interval between dispatch and arrival at the incident location inside the building. A responder who knows the building layout, the fastest route, and the exact room number will reach the victim faster than one navigating with a paper floor plan and verbal directions from a panicked caller.
In the external-only baseline, average travel distance was 246 meters and estimated response time 164 seconds, with remote third-floor incidents exceeding 220 seconds (IJSRA, 2025). Those figures assume responders start outside the building and work through using only exterior landmarks and verbal descriptions. When the incident's on an upper floor or in a back hallway, delays compound.
For multi-floor incidents, indoor-map routing cut travel distance an average 28.4 percent; reaching a third-floor lab dropped from 215 seconds to 154 seconds (IJSRA, 2025). The improvement came from pre-planned routes that accounted for stairwell locations, corridor layouts, and the building's vertical structure. Responders didn't waste time backtracking or searching for the correct stairwell.
The Navigation Problem in Large Facilities
A single-story elementary school with a simple rectangular layout is easy to work through. A multi-building high school campus with wings added over decades, a hospital with multiple towers and skybridge connections, or a corporate office park with identical-looking buildings is not. Responders arriving for the first time face a cognitive load problem: they must translate a verbal description or a grid reference into a physical path while managing adrenaline and time pressure.
Critical incident mapping vs 2D floor plan addresses this by providing a common reference frame. When dispatch says "Grid C-4, second floor," the responder can see that location on the map, identify the nearest entrance, and plan the route before leaving the vehicle. The map reduces ambiguity and aligns everyone's mental model of the building.
How Asset Visibility Supports Tactical Decisions
Knowing where resources are located changes how responders operate. If the map shows an AED in the main office and another in the athletic wing, the closest unit can grab the device en route to a cardiac emergency. If the map marks which doors are electronically locked and which are manual push-bar exits, responders can plan entry and egress routes that avoid bottlenecks.
In an active threat scenario, asset visibility extends to security cameras, intercom stations, and safe rooms. Incident commanders can see which cameras cover the hallway where the threat was last reported and direct responding officers accordingly. They can identify safe rooms where staff and students are sheltering and prioritize those areas for evacuation once the threat is contained.
What Do State Mandates Require for School Mapping?
State legislatures have passed digital mapping mandates in response to high-profile school incidents and the recognition that first responders often arrive with incomplete or outdated building information. These laws vary in scope, but most share common requirements around accuracy, format, and accessibility.
Wisconsin Act 109 requires school boards to submit the most recent blueprints or critical incident mapping data for each school building to each local law enforcement agency with jurisdiction, codified at Wis. Stat. 118.07(4)(cf) (Wisconsin Legislature, 2021). The law doesn't prescribe a specific format but emphasizes that maps must be current and accessible to responders.
Wisconsin Act 109 requires grant-funded critical incident mapping data to be compatible with public safety platforms, require no additional software purchase, and include building numbers, floors, suite designations, and room numbers (Wis. Stat. 165.88(3m)(c)) (Wisconsin Legislature, 2021). This interoperability requirement ensures that maps integrate with existing dispatch and mobile systems without forcing agencies to buy proprietary software.
The Interoperability and Format Standards
Interoperability means the map works with the tools responders already use. Dispatchers are designed to view maps in their Computer-Aided Dispatch console. Officers and firefighters view maps on tablets or smartphones in their vehicles. Incident commanders view maps on laptops at the command post. If the map requires a separate application, a special login, or a proprietary file format, adoption suffers.
Louisiana's Act 425 of 2026 (Senate Bill 126), effective June 20, 2025, provides for school mapping data of public school buildings and facilities and requires schools to submit critical information to GOHSEP for inclusion in the statewide critical incident and mapping system under R.S. 29:726.3 (Louisiana Center for Safe Schools, 2025). The statewide system centralizes data and ensures that any responding agency, regardless of jurisdiction, can access the same map.
Format standards typically require maps to include grid overlays, room labels, and asset markers. Some states specify that maps must be georeferenced, meaning they're tied to real-world latitude and longitude coordinates. This allows the map to be displayed on a GIS platform or integrated with GPS-enabled mobile devices.
Compliance Timelines and Funding Mechanisms
Mandates come with deadlines. Schools must submit maps by a certain date or risk losing state funding or facing penalties. Wisconsin's Office of School Safety has awarded Act 109 digital mapping grants to 378 Wisconsin schools and school districts, totaling more than $6.2 million (Wisconsin Department of Justice, 2026). Grant funding helps schools cover the cost of data collection, map creation, and ongoing updates.
Compliance isn't a one-time event. Buildings change, and maps must be updated to reflect those changes. Some mandates require annual recertification or re-submission. Schools that treat mapping as a one-and-done project will find themselves out of compliance within a year or two as renovations, additions, and equipment moves render the original map obsolete.
How Does a Living Digital Twin Stay Current?
A living digital twin isn't a static file. It's a geospatially and contextually aware model of the building and its lifecycle, built on a foundation of point cloud data enriched with cloud meshes and integrated data layers, with 3D Gaussian Splats available where a site calls for them. The exterior twin includes RTK-derived latitude and longitude for any location on the facility perimeter, providing centimeter-level positioning accuracy.
Critical incident mapping vs 2D floor plan becomes a question of lifecycle management. A 2D floor plan is a snapshot. A living digital twin is a continuously updated representation that reflects the building as it exists today, not as it was designed five years ago.
The twin integrates with facility management systems, security platforms, and IoT sensors. When a door is added, a camera is relocated, or a room is repurposed, the change flows into the twin. Responders and facility teams see the same current model, reducing the risk that someone makes a decision based on outdated information.
Point Cloud Capture and Contextual Enrichment
Point cloud capture uses laser scanning or photogrammetry to record the building's physical geometry. The result is a dense set of spatial coordinates representing walls, floors, ceilings, fixtures, and furniture. This raw data is then enriched with cloud meshes, which add visual texture and context; 3D Gaussian Splats can be layered on where a site calls for them.
Integrated data layers overlay operational information onto the spatial model. Asset tags, room labels, occupancy data, and equipment inventories become part of the twin. A responder viewing the model can see not just the shape of a room but also what's inside it, who's responsible for it, and how it connects to adjacent spaces.
The twin is geospatially aware, meaning it knows its position in the real world. Exterior coordinates are tied to RTK positioning, which provides centimeter-level accuracy. This allows the twin to serve as a common reference frame for multiple systems: dispatch, mobile apps, GIS platforms, and facility management databases.
Integration with Operational Systems
A living digital twin is designed to integrate with the systems that run the building and support emergency response. Security cameras, access control panels, fire alarms, and environmental sensors all generate data that can be visualized on the twin. When an alarm triggers, the twin shows the exact location and provides context: Is it a pull station in a hallway or a smoke detector in a mechanical room? What's the fastest route from the nearest fire station?
Integration with dispatch and mobile systems is on the roadmap for many platforms. The goal is to push map data to responders in real time, so they see the same view the dispatcher sees. This requires APIs, data standards, and agreements between the mapping provider, the school or facility, and the public safety agencies. Some implementations are available today; others are still in development.
See your building the way a first responder needs to.
Ark builds an operational digital twin of your facility from a single capture, so your team and responders can prepare, route, and defend every decision. Schedule a Demo.
What Are the Gaps in Static Gridded Maps?
A static gridded map is a step up from a 2D floor plan. It adds an alphanumeric grid overlay, asset markers, and geospatial alignment. It's the current category standard for critical incident mapping and a real improvement over paper floor plans. But it's still a flat, frozen artifact.
Critical incident mapping vs 2D floor plan often positions gridded maps as the solution. They're better than floor plans, but they share the same fundamental limitation: they capture one moment in time. When the building changes, the map doesn't. Updating a gridded map requires a new site visit, a new data collection effort, and a new file to distribute to all stakeholders.
Gridded maps also lack the contextual richness of a living digital twin. They show where things are, but not how they relate to each other or how they change over time. A gridded map can tell you which room is C-4, but it can't tell you that C-4 was a classroom last year and is now a storage closet, or that the door to C-4 was replaced with a security-rated model last month.
The Update Cycle Problem
Most facilities using static gridded maps update them annually, if at all. The process involves scheduling a site visit, walking the building with a mapping technician, verifying asset locations, and producing a new map file. That file is then distributed to the school, the local police department, the fire department, and any other agencies with response jurisdiction.
Between updates, the map goes stale. A new portable classroom is added. A hallway is closed for renovation. A fire extinguisher is moved from one wall to another. None of these changes appear on the map until the next annual update. In a fast-moving incident, a responder relying on an outdated map may waste time searching for an exit that's been blocked or an AED that's been relocated.
The Interoperability Ceiling
Gridded maps are typically delivered as PDFs or image files. These formats are easy to view and print, but they don't integrate well with other systems. A PDF can't be queried, filtered, or overlaid with real-time data. It can't be pushed to a mobile app or displayed on a GIS platform without manual conversion.
Some vendors offer proprietary platforms that host gridded maps and provide limited interoperability. These platforms may integrate with dispatch systems or mobile apps, but they often require agencies to purchase additional licenses or subscriptions. This creates a barrier to adoption, especially for smaller districts or rural agencies with limited budgets.
Which Approach Fits Different Facility Types?
Not every facility needs the same level of mapping sophistication. A small single-story building with a simple layout and low occupancy may be adequately served by a well-maintained 2D floor plan. A large multi-building campus with thousands of occupants, complex vertical circulation, and high regulatory scrutiny requires a more advanced solution.
Critical incident mapping vs 2D floor plan is a spectrum, not a binary choice. The right approach depends on building complexity, occupancy, regulatory requirements, and the capabilities of the responding agencies.
| Facility Type | Complexity | Best Fit | Key Consideration |
|---|---|---|---|
| Small K-5 school | Low | Gridded incident map | State mandate compliance |
| Large high school campus | High | Living digital twin | Multi-building coordination |
| Hospital or medical center | Very high | Living digital twin | Vertical circulation and hazmat |
| Corporate office park | Medium | Gridded incident map or twin | Tenant turnover and access control |
| Industrial facility | High | Living digital twin | Hazardous materials and confined spaces |
K-12 Schools and State Mandate Compliance
K-12 schools face the most prescriptive mapping mandates. In 2021-22, 96 percent of US public schools had a written plan for procedures to be performed in the event of an active shooter (National Center for Education Statistics, 2021). Those plans increasingly require digital maps that meet state standards for format, accuracy, and interoperability.
Small elementary schools with simple layouts can often meet compliance requirements with a gridded incident map. The map must include room numbers, exits, asset locations, and a grid overlay, but it doesn't need the full lifecycle management capabilities of a living digital twin. The key is ensuring the map's updated annually and shared with all responding agencies.
Large high schools and multi-building campuses benefit from a living digital twin. These facilities have multiple wings, additions built over decades, and complex circulation patterns. A static map struggles to keep pace with renovations, portable classrooms, and equipment moves. A living twin integrates with the school's facility management system and updates automatically as changes occur.
Healthcare and High-Occupancy Venues
Hospitals, stadiums, convention centers, and other high-occupancy venues present unique challenges. They have large floor plates, multiple levels, and high densities of people who may not be familiar with the building. Responders need detailed information about vertical circulation, egress routes, and the location of medical equipment or hazardous materials.
A living digital twin provides the contextual richness these facilities require. The twin can show which stairwells are pressurized for smoke control, which elevators are rated for firefighter use, and where oxygen tanks or radioactive materials are stored. It can integrate with the building's fire alarm and access control systems to show which doors are locked, which zones are in alarm, and where occupants are sheltering.
What Does Implementation Look Like in Practice?
Implementing critical incident mapping vs 2D floor plan requires coordination between the facility owner, the mapping provider, and the responding agencies. The process typically involves data collection, map creation, validation, distribution, and ongoing maintenance.
Data collection starts with gathering existing floor plans, as-built documentation, and asset inventories. For a living digital twin, this includes point cloud capture using laser scanning or photogrammetry. The capture team walks the building, recording spatial data and photographing key features. This process can take a few hours for a small building or several days for a large campus.
Map creation involves processing the raw data into a usable format. For a gridded incident map, this means overlaying the floor plan onto satellite imagery, adding a grid, and placing asset markers. For a living digital twin, it means generating cloud meshes and integrated data layers, with 3D Gaussian Splats as an available enhancement. The result is a geospatially aware model that can be viewed on multiple platforms.
Validation and Responder Training
Validation ensures the map is accurate and complete. The facility team walks the building with the map, verifying room numbers, asset locations, and access routes. Any discrepancies are corrected before the map is finalized. Some state mandates require this walk-through to be documented and submitted as part of the compliance package.
Responder training introduces the map to the agencies that will use it. Police, fire, and EMS personnel need to understand how to read the grid, locate assets, and work through using the map. Training sessions often include tabletop exercises where responders practice using the map to plan routes and coordinate actions during a simulated incident.
Distribution and Access Control
Distribution gets the map into the hands of responders. For a gridded incident map, this typically means uploading the file to a shared drive, emailing it to agency contacts, or posting it on a secure portal. For a living digital twin, it means granting access to the platform where the twin is hosted. Some platforms allow responders to view the map on their mobile devices in the field, while others require access through a desktop application.
Access control is critical. Maps contain sensitive information about building layouts, security systems, and asset locations. Unauthorized access could compromise security or enable a threat actor to plan an attack. Most platforms use role-based access controls, allowing facility administrators to grant view-only access to responders while reserving edit permissions for authorized staff.
The Bottom Line
Critical incident mapping vs 2D floor plan is a choice between static artifacts and lifecycle-aware models. Traditional floor plans freeze a building at a single moment and lack the geospatial context, asset visibility, and interoperability that responders need. Static gridded maps improve on floor plans by adding grids and asset markers, but they still go stale the day the building changes.
A living digital twin built on point cloud data, enriched with cloud meshes and integrated data layers, stays current across the building's lifecycle. It provides the spatial precision and contextual richness that support faster response times, better tactical decisions, and compliance with state mandates. For facilities facing regulatory requirements, high occupancy, or complex layouts, the twin is the foundation for preparedness, response, and day-to-day operations.
Frequently Asked Questions
What is the main difference between critical incident mapping vs 2D floor plan?
A 2D floor plan is a static architectural drawing showing walls and doors. Critical incident mapping adds geospatial alignment, asset markers, grid overlays, and integration with dispatch systems. The map is designed for emergency response, not construction.
Do state mandates require critical incident mapping or just floor plans?
Most state mandates require digital maps that meet specific standards for accuracy, format, and interoperability. Wisconsin and Louisiana explicitly require critical incident mapping data compatible with public safety platforms. A simple floor plan typically doesn't meet these requirements.
How often do critical incident maps need to be updated?
Most facilities using static gridded maps update them annually. A living digital twin integrates with facility management systems and updates continuously as changes occur. State mandates may require annual recertification or re-submission regardless of the mapping approach used.
Can we build critical incident maps in-house or do we need a vendor?
In-house teams can create gridded maps if they have GIS expertise and access to accurate floor plans and satellite imagery. A living digital twin requires specialized capture equipment, processing software, and integration capabilities that most facilities don't have internally.
What does it cost to implement critical incident mapping vs 2D floor plan updates?
Gridded incident maps typically cost a few thousand dollars per building for initial creation and a few hundred dollars per year for updates. A living digital twin requires a larger upfront investment for point cloud capture and platform access, but ongoing maintenance costs are lower because updates are automated.